
Hot Spots
 Reading Time: 3 minutes
What are YOU looking at?
Since our August theme is heat, I began searching for hot things that are business-related. First, I babbled about self-assured women. Now I’m moving on to something more scientific — heatmaps.
For example, we’re all starting to see those Choropleth maps pop up all over social media sites. Simply put, people just take statistical data and color-code it on a map to make it easy to digest. (As we know, people are losing their ability to read, as a result of overdosing on Twitter and Instagram.) See the links below on how to make your own. It’s a useful skill to have if you want to impress your clients or your boss — or you’re just bored on a rainy day.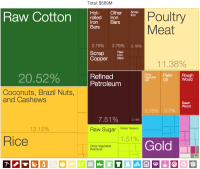
Data grows on trees
Then, we have these things called Treemaps, which puts data into little rectangles. (See diagram at right.) It looks nothing like a tree. Go figure. But it’s very pretty and tidy. It’s like a pie chart, but it’s rectangular. Perhaps they are for data analysts who are tired of pie.
Made Ya Look!
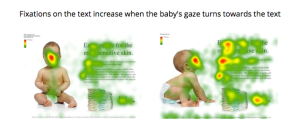 My fave heatmaps these days are the ones used to track web behavior. At theONswitch we use Google Analytics every week. And we’ve learned how to find all kinds of cool data about web traffic. But heatmaps make studying the data much more fun because you can see instantly — via color-coding — where your prospects’ eyeballs are going on the site. Rather than debating with a designer or programmer about what looks hotter, you can actually see what works. A novel concept indeed! Here’s a great example of how just turning a photo a certain way can increase how often the text is read. And no, the baby doesn’t have a skin disease…that’s just what web heatmapping looks like. (Insert shameless plug here…my company builds great websites. Call me.)
Data visualization (pictures that make numbers easier to digest) is trending these days. We visual thinkers are rejoicing.
Next week, I’ll probably be covering something else that’s hot but perhaps less dense. After all, the summer should be hot AND fun!
 |
Make your own Choropleth map boys and girls! Here’s how!I found other ways to make them, but it seemed really complicated and I got a headache. |
 |
Use heatmap data to engage your customers. A great article on where people look. |
 |
Slightly off-topic. If you’re tired of cold spots in your microwaved food, this new device solves the problem. (It relates to heatmapping, so it’s not totally random.) |
| Reviews of web heatmap tools. See, I can be useful AND snarky! |